One accurate measurement is worth a thousand expert opinions
– Grace Hopper
As I meandered around our new house, it was apparent some rooms were sweltering, others were freezing, and the thermostat was lying about everything.
I could feel it.
But I felt compelled to measure it. I was struck by the need to know:
- The temperature of each room
- How it changed throughout the day
- And how to monitor changes over time
And I fulfilled my weird compulsion with a few simple tools:
- Cheap temperature and humidity sensors from Home Depot
- Home Assistant
- The original internet of things protocol: radio.
Cheap temperature sensors
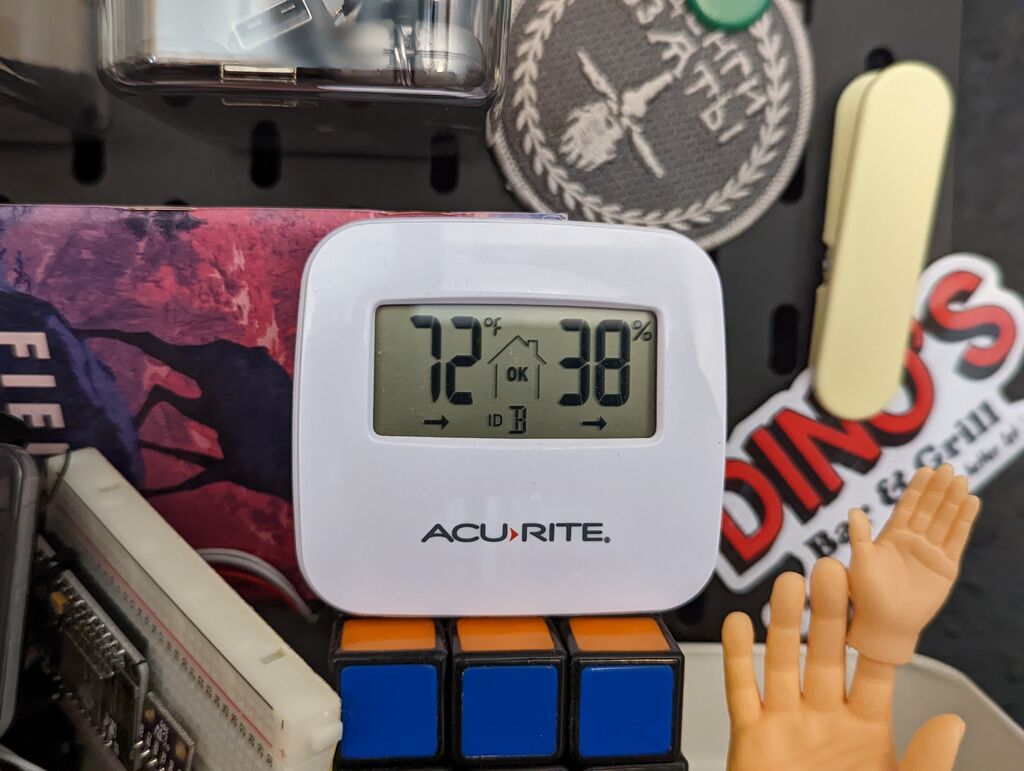
I have a handful of AcuRite sensors sprinkled throughout my house.
These sensors are $16 today, but I bought mine around 2017 for $12 each at Home Depot.
I know I could cobble together a cheaper temperature sensor:
| SHT30 temperature/humidity sensor | $1 |
| WeMos esp8266 | $5 |
| D1Mini OLED screen | $2 |
| Shipping | ~$2 |
| A month of waiting for shipping | priceless |
So for like $10 + solder + a weekend fiddling, you could make a craptastic internet-equipped temperature/humidity sensor.
But I dreaded building it.
Tinkering with electronic doodads is a fun hobby. But I just wanted something cheapish that would work.
And the AcuRites work.
Plus, the AcuRites work forever on a couple AAAs because they eschew power-hungry wifi in favor of squawking data on 433 MHz.
433 MHz, the original IoT protocol
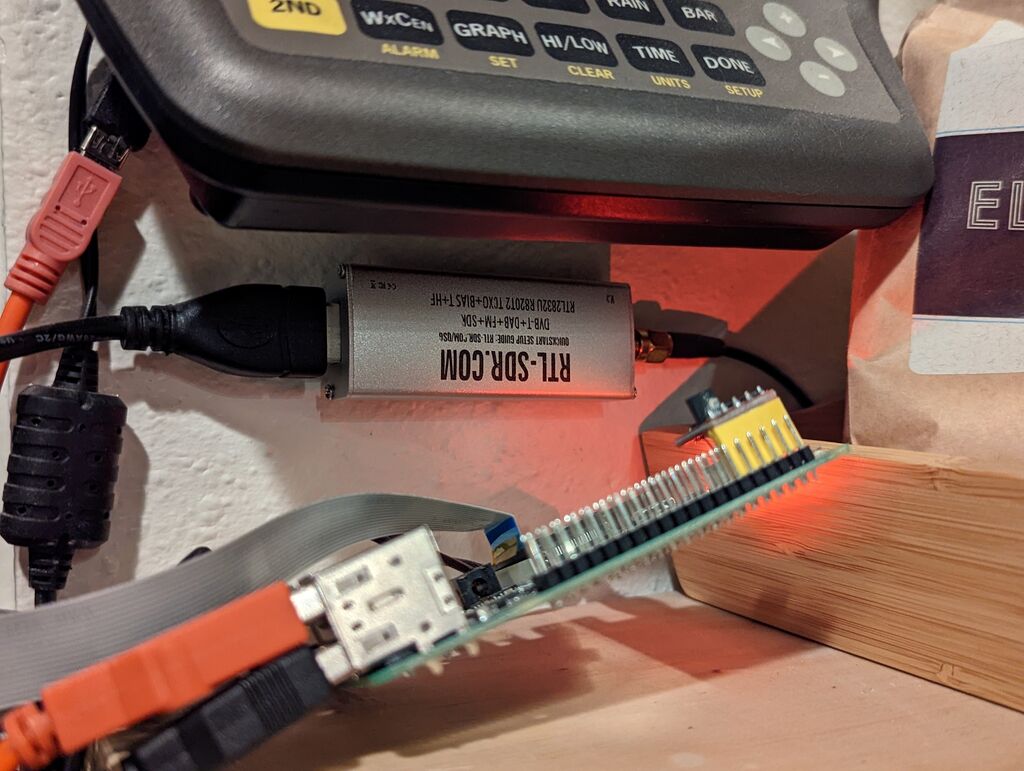
Even though 433.92 MHz sits squarely in the 70cm ham band, tons of electronic junk spews signals on that frequency.
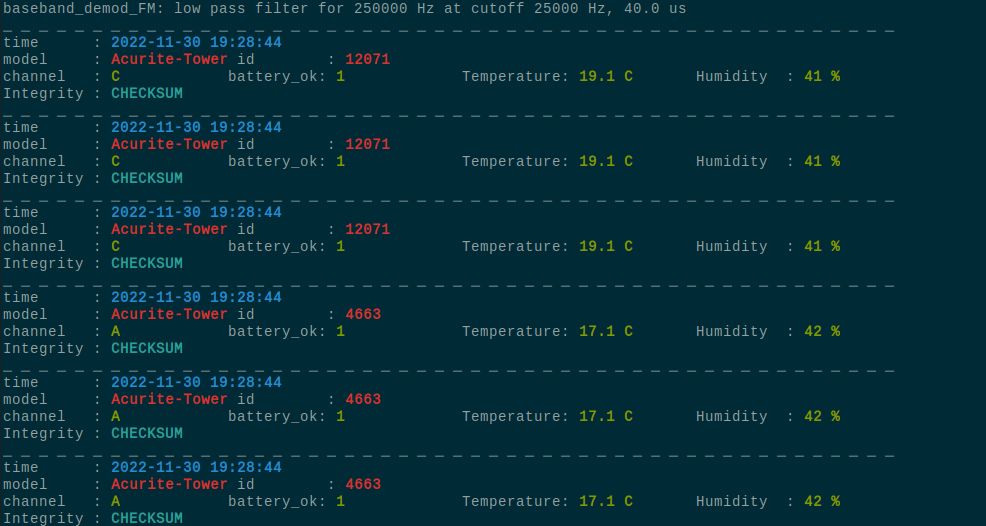
And with a $25 USB dongle and free software, it’s easy to decode messages chirped out by your AcuRite temperature sensors.
So far, this project had been cheap and simple. But the next step, gathering the data into a time-series database, required more fiddling than I’d expected.
Home Assistant, MQTT, Prometheus, and Grafana.
It was a pain to get rtl_433 data into Home
Assistant.
Maybe I’m missing something. But I ended up with a more complex system than I wanted:
- a systemd unit running rtl_433 with syslog output over UDP:
rtl_433 -F syslog:127.0.0.1:1433 - a systemd unit relaying and filtering syslog output to MQTT (based on this upstream example)
- a systemd timer to restart rtl_433 when it unexpectedly hangs (often)
After endless fiddling, the relay has an uptime measured in months—it’s stable.
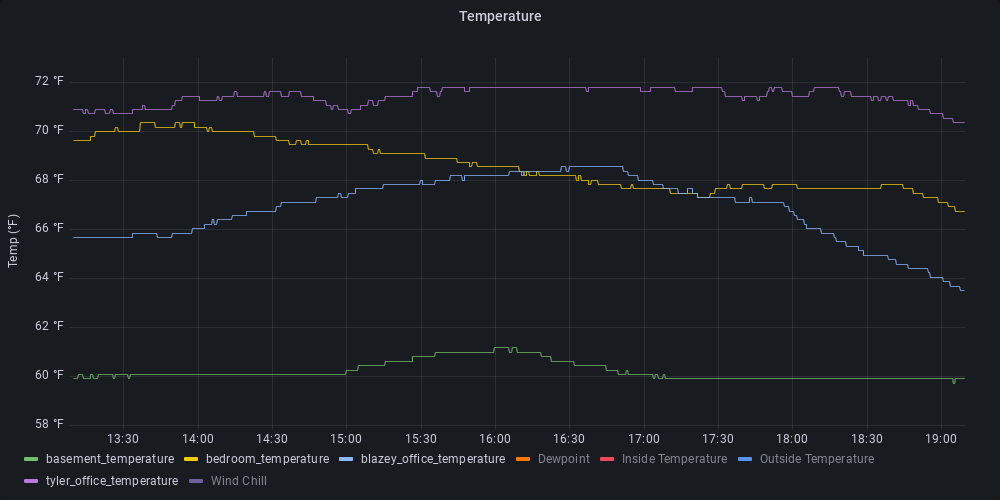
From there, pushing data to Home Assistant, exposing it via the Prometheus plugin, and graphing it with Grafana was a breeze.
Given all this work I’m happy to confirm what I’d long suspected: some rooms in my house are hot while others are cold.