There’s a scene in AMC’s “Breaking Bad” where Gail Boetticher explains to Walter White how to make the perfect cup of coffee. And it all sounds so plausible—there’s a perfect coffee, and science will magic it for us.
That whole idea, scene, and contraption are, of course, wrong.
But there are real ways to experiment your way towards a more perfect cup.
🗺️ The quest for good coffee
In 1957, a professor of food science at MIT forever changed what we think of as good coffee.
E.E. Lockhart posited that coffee flavor is the result of two variables:
- How much coffee you use
- How much of that coffee dissolves into the final cup (total dissolved solids—TDS%)
Lockhart surveyed a bunch of people to suss out the ideal range for these values, creating the “Coffee Brewing Control Chart,”—which is still in use today.1

And you can use Lockhart’s data to better your own brew.
🔬 Coffee science at home

When he was developing the Aeropress, Alan Adler was a frequent poster on the coffeegeek forums. There he shared the results of his experiments measuring coffee using a simple brix refractometer.
And, unfortunately for everyone in my immediate family—I own one of those, too!
🧪 An experiment: finding the ideal grind for the Hario v60
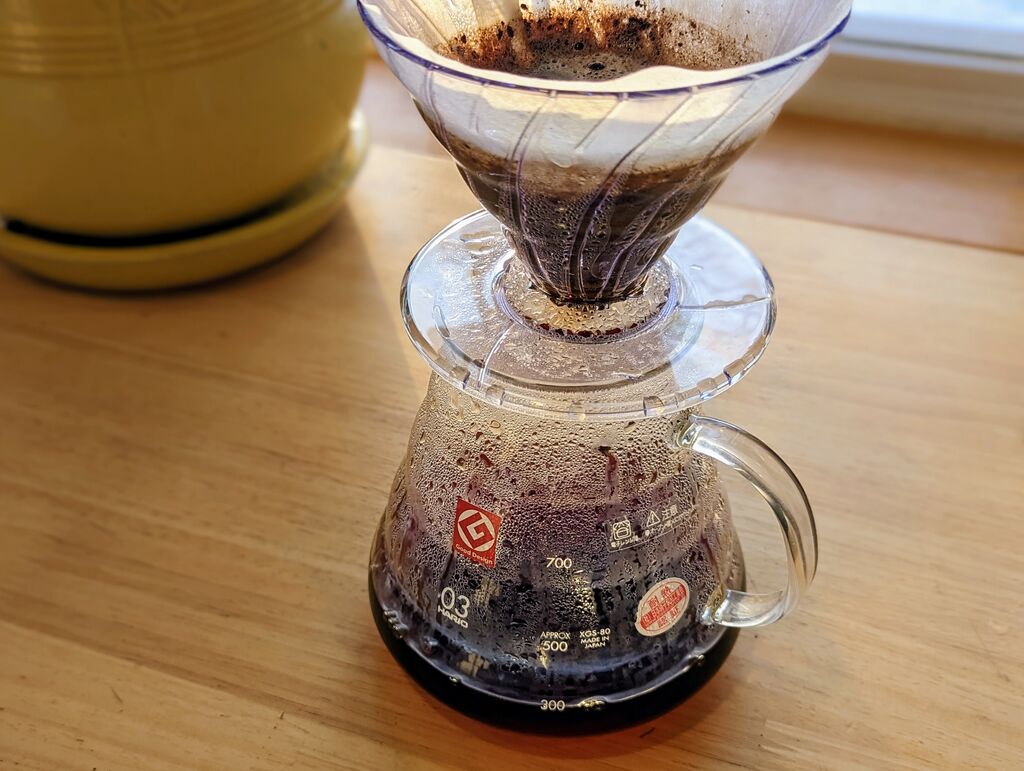
Over Christmas, I got a Hario v60 pour-over brewer. And I used science to zero-in on what I think is the perfect grind size.
Materials
- Hario V60 plastic dripper
- Baratza Virtuoso
- Bonavita electric kettle
- Escali Primo gram scale
- Ethiopia Refisa dry process from Ozo coffee
- Tap water—the miracle of modernity
Methods and Results
I tried to brew two cups of coffee the exact. same. way. Except for one variable: the grind.
| Variable | Course grind | Fine grind |
|---|---|---|
| Grinder dial setting | 22 | 17 |
| Water temperature | 95°C | 95°C |
| Water amount | 320g | 320g |
| Coffee used | 20g | 20g |
| Coffee brewed | 277g | 271g |
| TDS% | 1.4% | 1.7% |
| Extract% | 20% | 23% |

This measured difference is obvious, but can I taste a difference?
Taste and preference
A widely used protocol for figuring out if you can discern a difference between two products is the triangle test.
In a triangle test, you present three cups of coffee: two are identical, one is different. The goal is to pick out the odd cup consistently (better than random change; i.e., 1/3).
So, I took my two coffees and split them into 3 cups:
- 3 cups: A, B, and C
- Cups A & C – fine grind (“17”)
- Cup B – course grind (“22”)
And, then I mixed up the cups and tried to pick the odd one out:
| Result | Trial | Different cup | Cup I picked |
|---|---|---|---|
| ✅ | 1 | B | B |
| ✅ | 2 | B | B |
| ❌ | 3 | B | A |
| ❌ | 4 | B | A |
| ✅ | 5 | B | B |
As dramatic as the chart above looks, picking the “different” cup was tricky. I encourage you to try it—it was a fun experiment.
In the end, I preferred the course grind—it seemed sweeter and fuller vs. the fine grind. The fine grind coffee was astringent: sharp and tannic.
🍕 Coffee cognition theory
The theory of pizza cognition tells us that an individual’s first and primary source of pizza … will become the pizza against which all others are judged.
– Sam Sifton, The New York Times
I prefer strong coffee.
But I also prefer a light roast, single-origin coffee.
Much of the science of coffee is about extraction. But the art of coffee is hundreds of other choices: light roast, dark roast, Ethiopian, Sumatran, dry process, honey process, “briping,” and any other outre preference folks would find criminal to omit.
So far there have been three waves of coffee in the United States:
- First wave – Instant coffee. Diner coffee. Folgers.
- Second wave – Dark roast. Peet’s/Starbucks.
- Third wave – light roast, single origin: Blue bottle/Stumptown.
What I consider “good coffee” is a product of when I started drinking coffee—smack in the middle of the third wave.
But there’s no perfect coffee, no matter what Gail Boetticher says.
In 2020, scientists recreated Lockhart’s experiment—the coffee chart holds up! But cluster analysis holds some new insights: https://ift.onlinelibrary.wiley.com/doi/abs/10.1111/1750-3841.15561↩︎